Some statistics #
Various research projects focus on learning more on how open source communities work:
- What makes people
commit themselves to such projects?
- How much involvement from various companies is there?
- Do people
contribute during working hours or in their spare time?
- Who are the most active contributors in terms of
individuals and in terms of companies?
When asked to fill out surveys, especially in cases where that happens for the n-th time with n being larger than say 5, software developers usually are not very likely to fill out these questionairs. However knowing some of the processes of open source software development it soon becomes obvious there are way more extensive sources for information - albeit not trivial to evaluate and prone to at least some error.
Free software tends to be developed “in the open”: Project members with various backgrounds get together to collaborate on a common subject, exchanging ideas, designs and thoughts digitally. Nearly every project with more then two members at least has mailing list archives and some sort of commit log to some version control system. Usually people also have bugtrackers that one can use as a source for information.
If we take the ASF as an example, there is a nice application to create various statistics from svn logs:
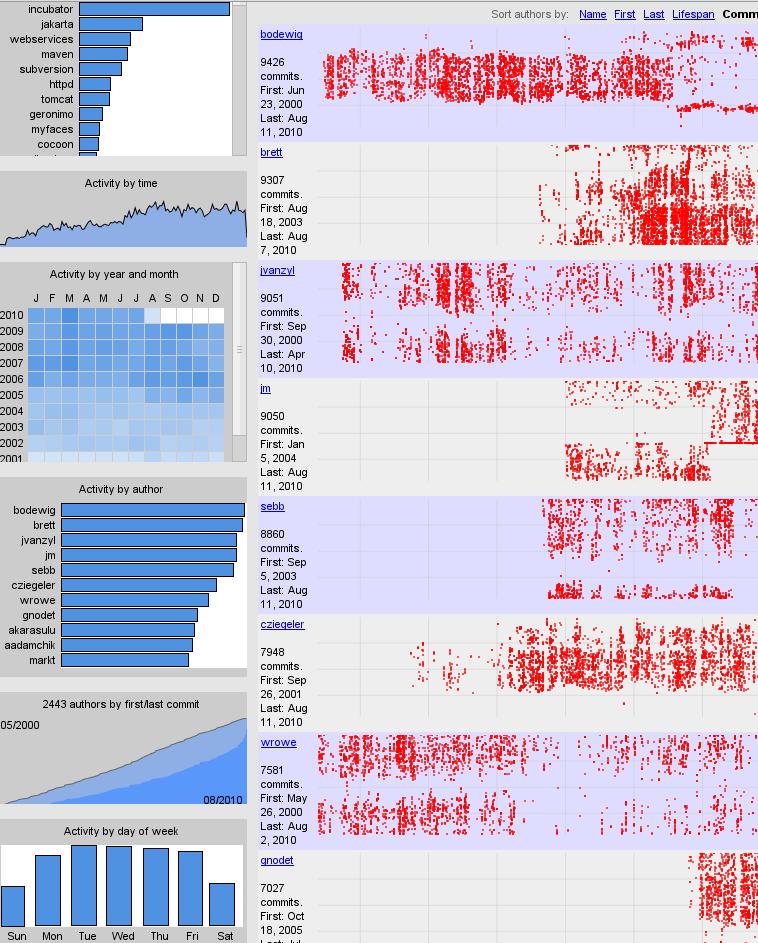
The caveats of this analysis are pretty obvious: Commit times are set according to the local of the server, however that may be far off compared to the actual timezone the developer lives in. Even when knowing each developer’s timezone there is still some in-accuracy in the estimations as people might cross timezone bounderies when going off for vacation. Still the data available from that source should already provide some input as to when people are contributing, how many projects they work on, how much effort in general goes into each project etc.
Turning the analysis the other way around and looking at mailing list contributions, one might ask whether a company indeed is involved in free software development. One trivial, naive first shot could be to simply look for mailinglist postings that originate from some corporate mail address. Again the raw numbers displayed below have to be normalised. This time company size and fraction of developers vs. non-developers in a company has to be taken into consideration when comparing graphs and numbers to each other.
Yet another caveat are mailinglists that are not archived in the mail archiving service that one may have choosen as the basis for comparison. In addition people may contribute from their employer’s machines but not use the corporate mail address (me personally I am one of these outliers, using the apache.org address for anything at some ASF project).
101tec  | JTeam 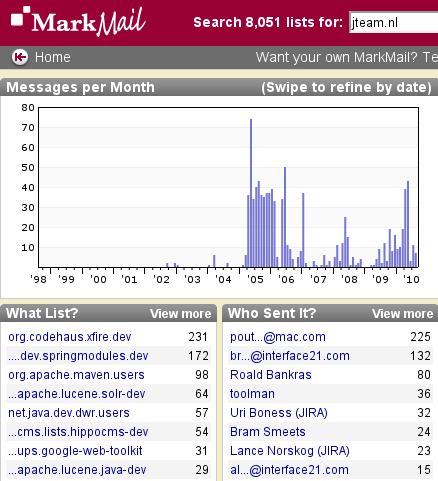 | Tarent  | |
Kippdata 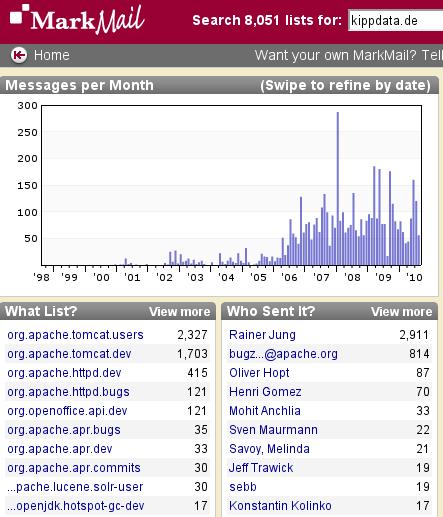 | Lucid Imagination  | Day  | |
HP  | IBM 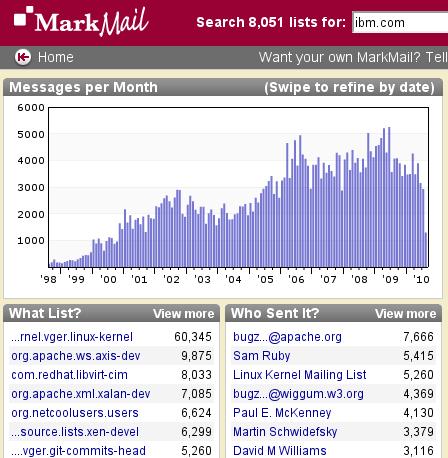 | Yahoo! 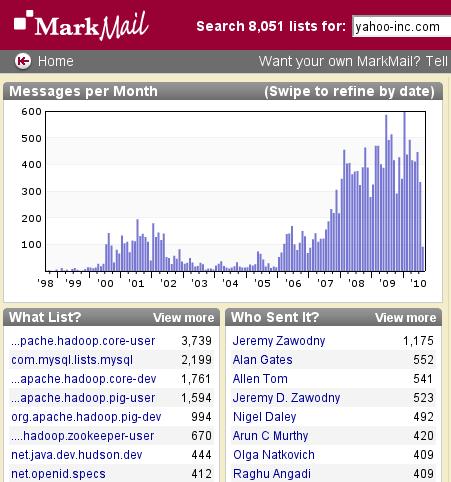 | |
Nokia 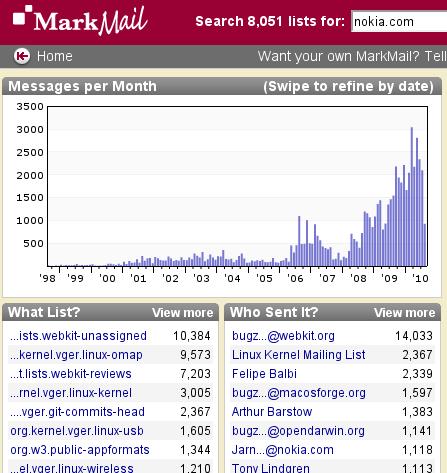 | Oracle 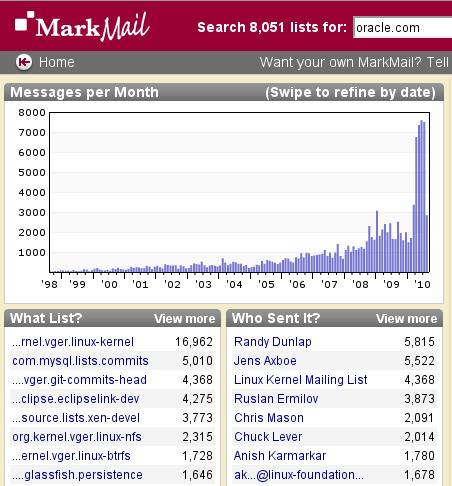 | Sun 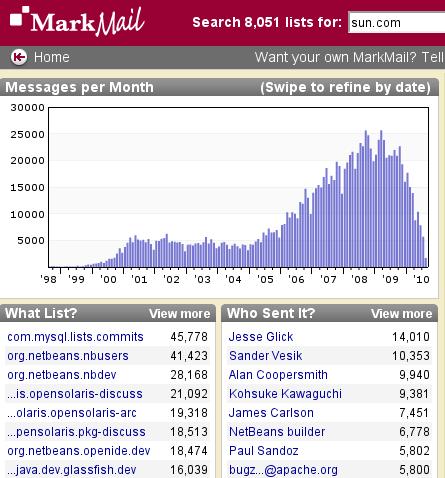 |
Easily visible even from that trivial 5min analysis however is general trending of involvement in free software projects. In addition those projects are displayed prominently projects that employees are working with and contributing to most actively - it comes as no surprise that for Yahoo! that is Hadoop. In addition if graphs go back in time far enough, one might even see the timeframe of when a company changed its open source strategy (or was founded (see the graph of Lucid), or got acquired (see Sun’s graph), or acquired a company with a different stategy (see Oracle’s graph) ;) ).
Sort of general advise might be to first use the data that is already out there as a starting point - in contrast to other closed communities free software developers tend to generate a lot of it. And usually it is freely available online. However when doing so, know your data well and be cautious to draw premature conclusions: The effect you are seeing may well be caused by some external factor.